10x Visium Data in FUSION
How to load a new 10x Visium dataset locally in FUSION
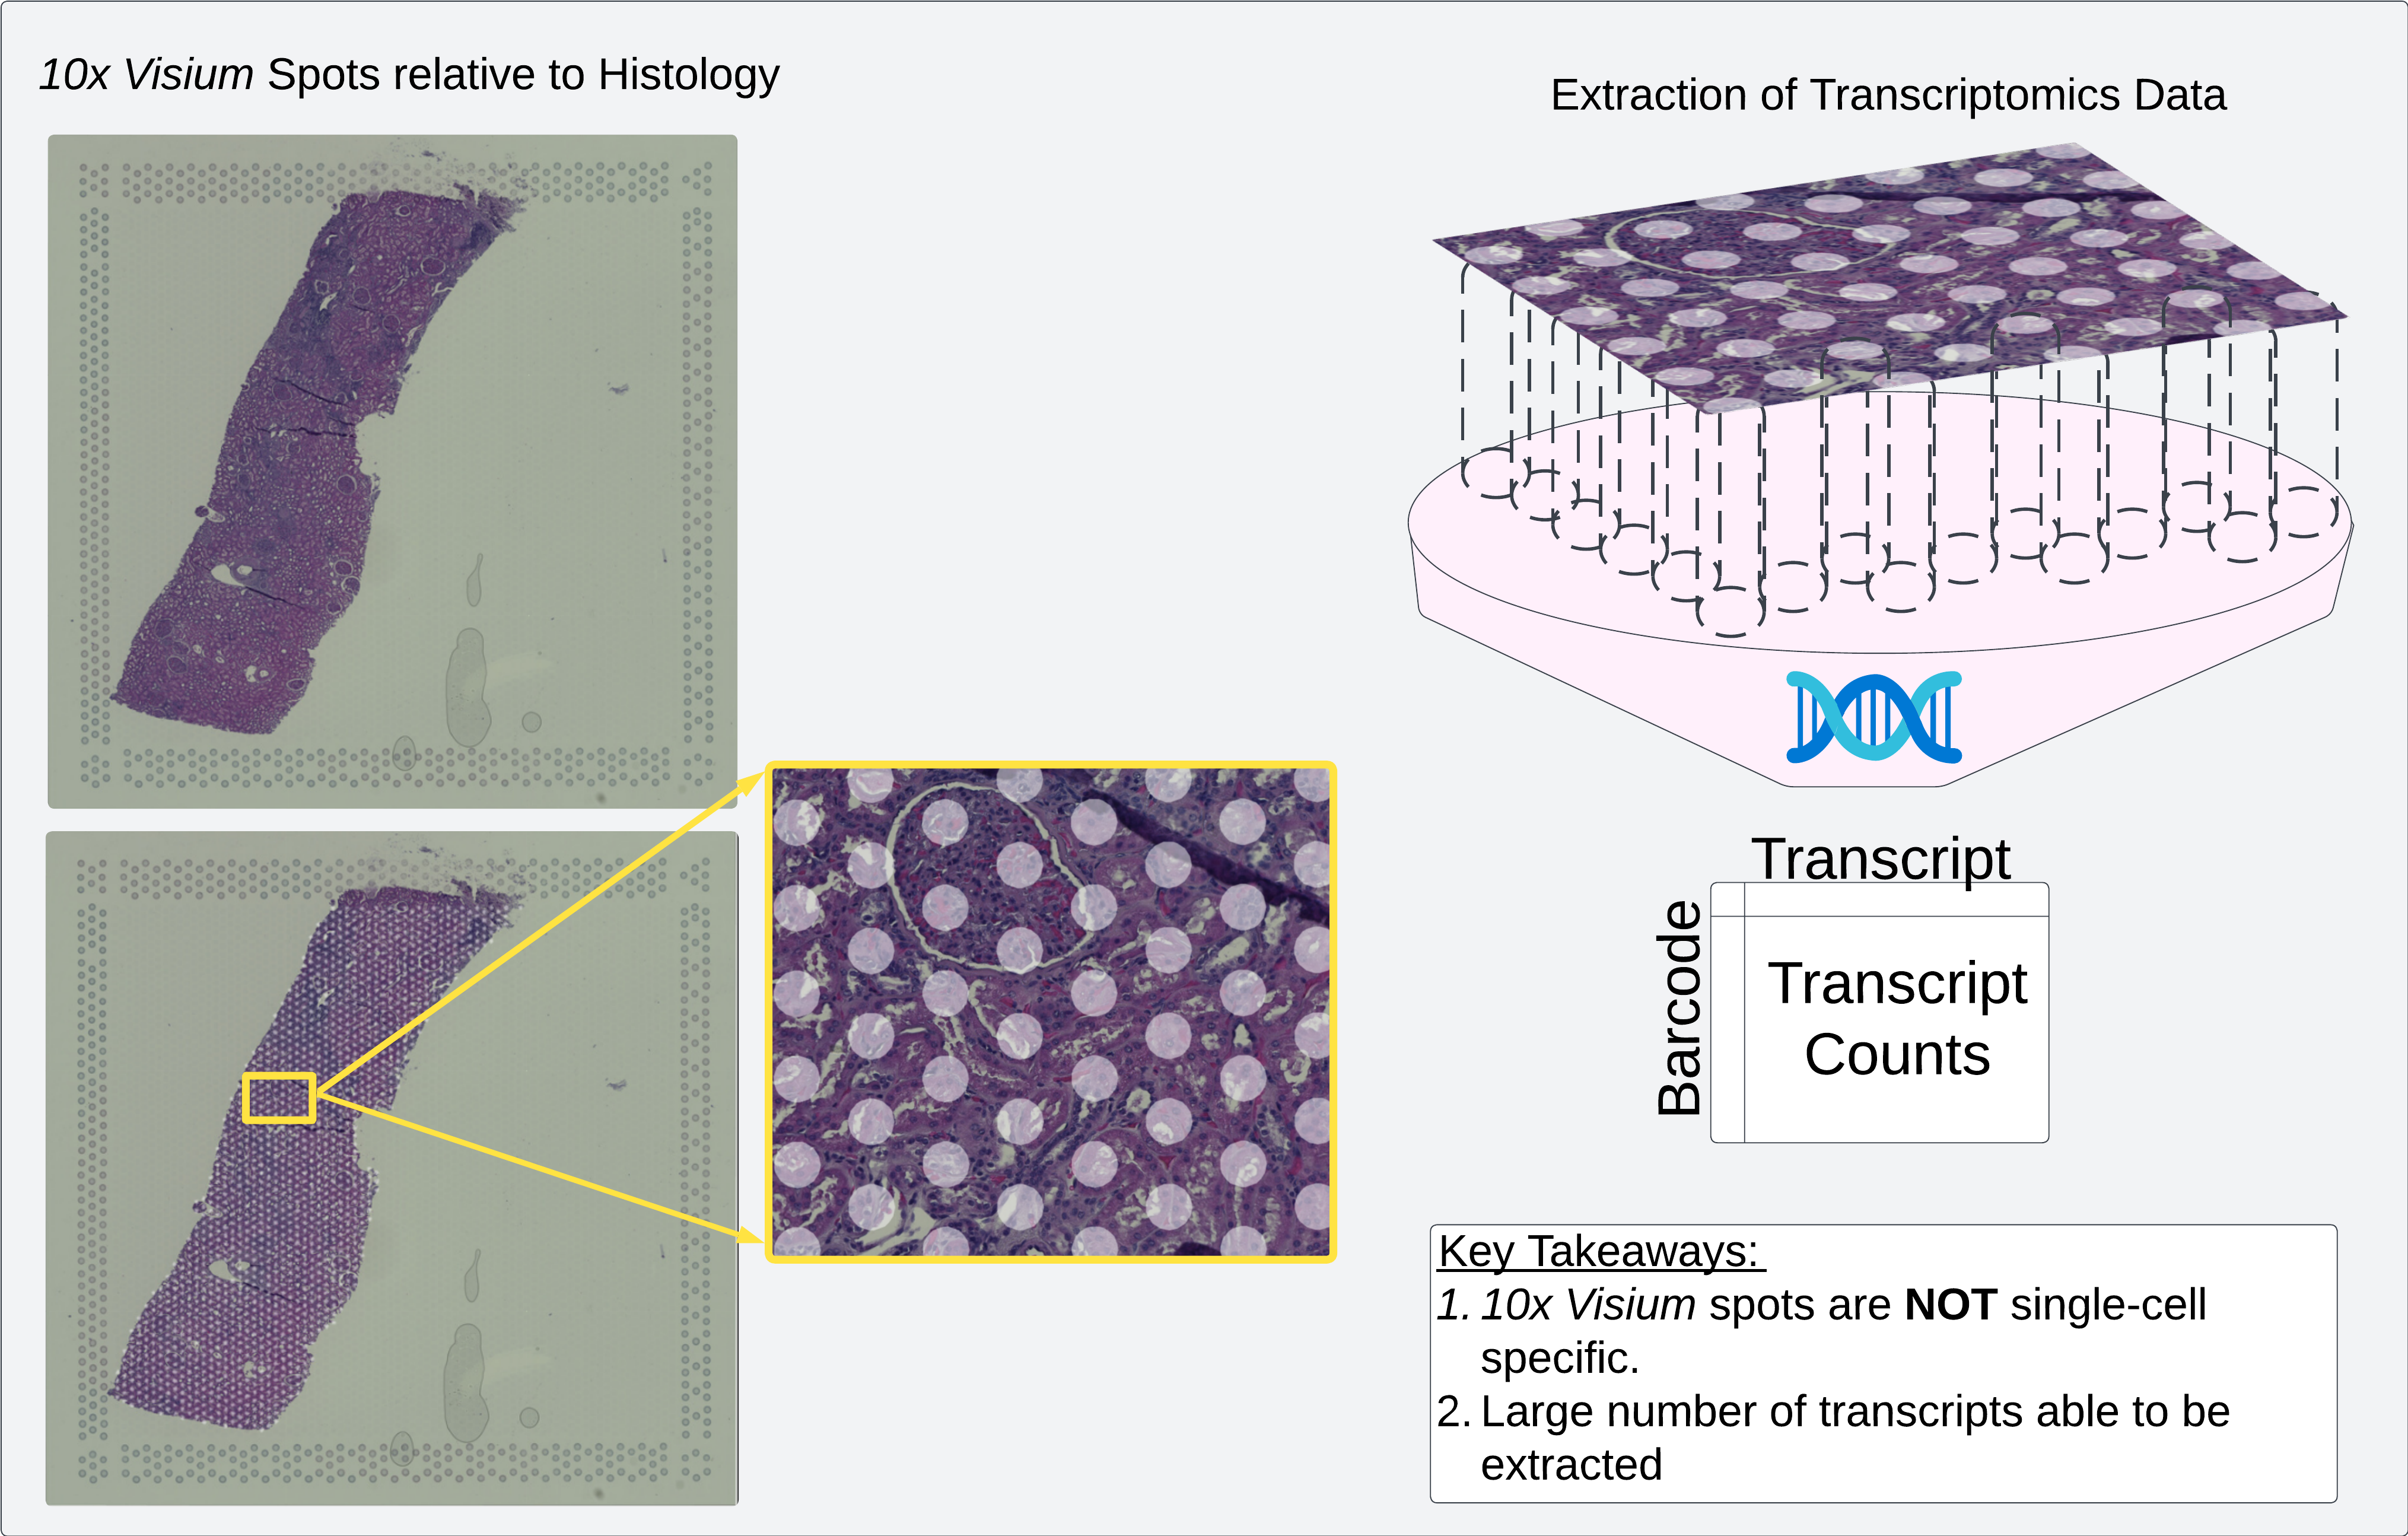 Diagram of 10x Visium spots relative to histology. In 10x Visium, transcriptomics data is extracted from tissue at each spot location
10x Visium Data
10x Visium data is a spatial transcriptomics technique wherein physical tissue is extracted from known locations, denoted using unique oligonucleotide sequences as barcodes. These locations, colloquially referred to as “spots”, are circular locations with a 50 micron diameter, separated from adjacent spots by 100 microns.
Because physical tissue is extracted from each spot location, there is a preference for using thicker tissue sections with this technique. This is due to the fact that more tissue present in sequencing increases the likelihood of capturing all transcript sequences present. However, this preference for thick sections differs from the standard histological preparation procedure for clinical data wherein thinner sections reduce overlap between cell nuclei at different z-axis locations.
That being said, the 10x Visium technique enables extraction of counts for a large number of transcripts (~17,000), which makes it a good candidate for comparison with “bulk” or single-cell sequencing techniques.
Loading 10x Visium in FUSION
FUSION was originally developed to handle some of the challenges inherent in 10x Visium. 10x has come out with two different “versions” of the way that Visium data is organized, although processing in FUSION is identical for both.
The main function involved can be found in fusion_tools.utils.shapes and is called: load_visium. Import it like so:
1
from fusion_tools.utils.shapes import load_visium
The input arguments for this function are:
- visium_path: Path to either the AnnData formatted (h5ad) file or the “tissue_positions.csv” file with columns for the row and column coordinates for the center of each spot.
- include_var_names: List of additional “var” variables to add to the generated annotations (for h5ad, if path to tissue_positions.csv is used, these lists are combined and interpreted as additional columns in the “tissue_positions.csv” file).
- include_obs_names: List of additional “obs” variables to add to the generated annotations (for h5ad, if path to tissue_positions.csv is used, these lists are combined and interpreted as additional columns in the “tissue_positions.csv” file).
- mpp: Microns-per-pixel value to use when generating spot boundaries. If not provided, this is automatically calculated.
- scale_factor: If you want to generate annotations for the high-res or low-res images, you can pass the scale factor found in “scalefactors_json.json” here. By default, FUSION uses the “tissue_hires_scalef” value. If that is not found and the path to the “scalefactors_json.json” file is passed then an error will be thrown. Alternatively, a float value corresponding to the appropriate scale factor can also be passed. If left empty, FUSION will generate annotations corresponding to the full-resolution image.
- verbose: Whether or not to show a tqdm progress bar when generating spot boundaries.
As an example:
1
2
3
4
5
6

og_spot_annotations = load_visium(
  visium_path = './spatial/tissue_positions.csv',
  scale_factor = './spatial/scalefactors_json.json'
)
Would be sufficient to create annotations for a 10x Visium experiment for overlaid visualization on the hires image.
By default, each spot will have the “barcode” added as a property. If you have a separate file you want to use to add more properties to each spot, the align_object_props utility function can be used like so:
1
2
3
4
5
6
7
8
9
10
from fusion_tools.utils.shapes import align_object_props

more_properties_spot_annotations = align_object_props(
  geo_ann = og_spot_annotations, # This is the output of load_visium
  prop_df = new_properties_dataframe, # This is a Pandas DataFrame containing new properties
  prop_columns = ['list','of','columns','to','include','in','new_properties_dataframe'], # These are the columns you want to add as properties to your spots
  alignment_type = 'barcode', # This alignment type finds matching barcodes and assigns new properties to the matching spot. Alternatively, you can add properties by "index" or any other property name already assigned to that spot
  prop_key = 'New Properties' # This parameter is optional, added properties will appear under "New Properties" which can be useful if you have multiple clustering methods that are all called "cluster"
)
Once the annotations are created, you can create a visualization in FUSION with whatever set of components you want using the Visualization object:
1
2
3
4
5
6
7
8
9
10
11
12
13
14
15
16
from fusion_tools.visualization import Visualization
from fusion_tools.components import SlideMap, OverlayOptions

vis = Visualization(
  local_slides = ['./spatial/tissue_hires_image.png'],
  local_annotations = [[more_properties_spot_annotations]],
  components = [
    [
      SlideMap(),
      OverlayOptions()
    ]
  ]
)

vis.start()