10x VisiumHD Data in FUSION
How to load a new 10x VisiumHD dataset locally in FUSION
 https://www.10xgenomics.com/blog/your-introduction-to-visium-hd-spatial-biology-in-high-definition
10x VisiumHD Data
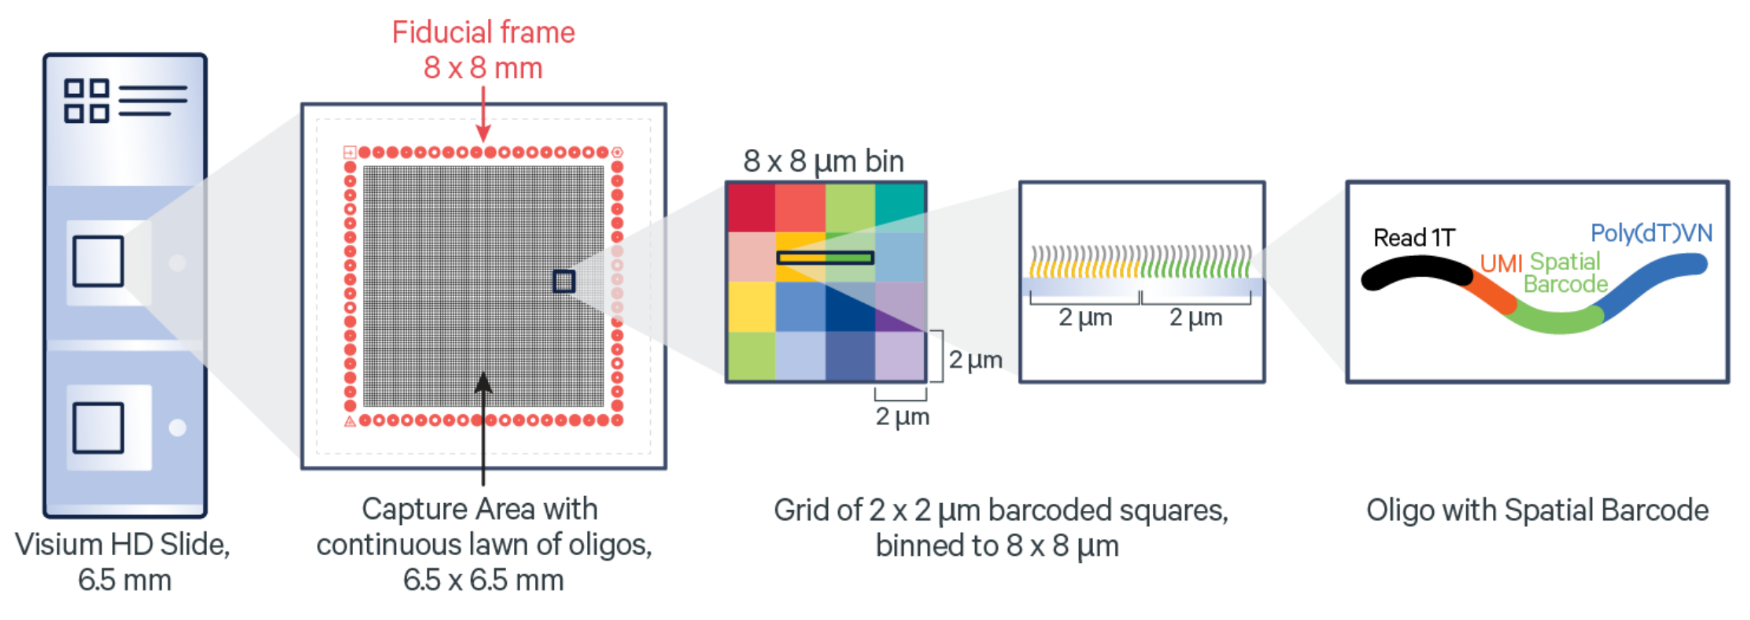
Similar to the original 10x Visium method, 10x VisiumHD is a spatial transcriptomics method wherein barcoded regions are used as a basis for extraction of sequencing data. Unlike Visium, VisiumHD provides a continuous “lawn” of oligonucleotide squares (not circular spots!) which enables high resolution extraction and visualization of gene expression in a sample. These square fiducials, at their highest resolution, have horizontal and vertical dimensions of 2 micron. Adjacent squares can also be “binned” in order to get a more easy to handle/interpret amount of data.
By default, 10x refers to these different resolutions by just one of their spatial dimensions (e.g., 2um would be the 2um x 2um squares). So while the name of the resolution level may be 2, 4, 8, etc. the area of the fiducial is actually 4, 16, 64 square microns. Regardless, this is a substantial improvement compared to the original Visium where the 50 micron diameter spots covered areas of ~1963.5 square microns (pi*(50/2)^2).
Loading 10x VisiumHD in FUSION
Loading VisiumHD data in FUSION is very similar to loading regular Visium annotations. A utility function is present in fusion_tools.utils.shapes called load_visiumhd which can be imported using:
1
from fusion_tools.utils.shapes import load_visiumhd
The input arguments for this function are:
- visiumhd_path: Path to the “binned_outputs” for this experiment
- resolution_level: Number representing the length of one side of the fiducial square
- include_analysis_path: Path to various analyses performed on these ROIs, can either be output of spaceranger or any csv file with “barcode” column to be used for alignment. (For multiple, use a list [])
- include_analysis_name: Name to use for each included analysis. If none are provided, name is inferred from {path}.split(os.sep)[-2]
For example:
1
2
3
4
5
6
7
8
# In sample directory
visiumhd_annotations = load_visiumhd(
  visiumhd_path = './outs/binned_outputs/',
  resolution_level = 'square_016um',
  include_analysis_path = ['./outs/binned_outputs/square_016um/analysis/clustering/gene_expression_graphclust/clusters.csv'],
  include_analysis_names = ['Graph Clustering Label']
)
Because VisiumHD contains a much larger number of fiducials compared to Visium, I recommend using the LargeSlideMap classes (Each type of SlideMap also has a “Large” variant, LargeSlideMap, LargeMultiFrameSlideMap, LargeHybridSlideMap). These types of SlideMaps are useful because they only load a subset of all the annotations depending on what region you are currently observing.
For example:
1
2
3
4
5
6
7
8
9
10
11
12
13
14
vis = Visualization(
  local_slides = ['/path/to/full_resolution/image.tif'],
  local_annotations = [[visiumhd_annotations]],
  components = [
    [
      LargeSlideMap(
        min_zoom = 4 # This means that annotations are only loaded once you are at zoom level 4 and over
      ),
      OverlayOptions()
    ]
  ]
)

vis.start()